Case Studies
Industries
Resources
Ratings & Reviews
NEW
29 min read


Everyone has an opinion on the best way to market your brand on Instagram. You could read five different examples of the best Instagram posting rate strategy, discover three differing articles on the fastest ways to increase engagement rate, while looking at four infographics on mastering the hashtag, and still have no idea how to develop an Instagram Marketing Strategy.
When you feel like you’re staring at a wall of information – with seemingly no way to turn it into an actionable strategy – we always find that the best thing to do is look at the data.
Prior to the deprecation of the Instagram API in April 2018, our analytics team pulled data on 394 brands, with followerships ranging from 5,000 to 10.5 million. This historic data was collected over the last 8 months, with each brand analysed over a 28 day window from Monday to Sunday.
We measured 14 different Instagram metrics, with the intention of making an Instagram Marketing Strategy Masterlist. This kind of study is no longer possible with the new API, making this information incredibly valuable to brands marketing on Instagram.
Get ready to develop the ultimate Instagram Marketing Strategy based on the numbers.
What can our data help your brand learn about Instagram marketing strategy?
The metrics range from simple numbers like ‘the average number of posts per day’ through to complex metrics, like the ‘average number of likes posted on images using the brand’s primary hashtag’. And we provide you with the interpretation you need to understand what it all means. All with the objective of providing your brand with accurate information that can help every eCommerce or Social Media manager refine their Instagram marketing strategy.
This post will give you Instagram Marketing Strategy tricks including:
Read the whole thing or jump through to the metrics that you’re most interested in!
Part I: Engagement
Part II: Metrics on Hashtag
Part III: User Quality
Using our advanced Instagram analytics tools, we’re able to gain lots of meaningful insights into developing an Instagram Marketing Strategy. So here we go! Let’s get started with everyone’s favorite: Instagram engagement.
We’re beginning with Instagram’s biggest buzzword: engagement. We’re all obsessed with engaging people on social media and, these days, engagement feels tough to come by.
So what can your brand do in order to ensure optimal engagement rates?
This section will focus on metrics that are under a brand’s control, starting with posting rate.
There’s a rumor going around that over-posting is a detriment to your brand. While it’s possible that this has some merit, it’s also possible that posting rate is more of a headache for your Social Media team than for your followers.
To dispel this looming doubt over how often your brand should be posting, let’s look at the data.
| No. Brand posts in 28 days | No. Posts Per Day | Daily Eng Rate by Likes | |||
| Bottom 3 | |||||
| @dalstontime | 1 | 0.036 | 0.05% | ||
| @bonechocollective | 1 | 0.036 | 0.01% | ||
| @arnette | 1 | 0.036 | 0.01% | ||
| Top 3 | |||||
| @moschino | 162 | 5.786 | 1.95% | ||
| @happysocks | 172 | 6.143 | 5.30% | ||
| @brigademondaine | 223 | 7.964 | 7.79% | ||
| Average | |||||
| 34.6 | 1.236 | 1.26% | |||
CM Table 1 – Bottom 3 / Top 3 on the posting rate of brands from our sample of 395. We include the Daily Engagement Rate by Likes to allow for comparisons that show the positive effects of posting more regularly,and the negative effects of not posting enough.
This table shows us the Daily Engagement rates rather than rate per post. Here we can see the bottom 3 and the top 3 performing brands for this metric. Pretty stark, right?
Brigade Mondaine, luxury lingerie brand, is posting around 8 times per day, and they are clocking in a huge engagement rate of 7.79%. This is miles above well-established brand, Arnette, with 47.1k followers posting just once in a 28 day window and engaging just 0.01% of their audience each day.
Now, let’s switch over and look at the relationship between a brand’s posting rate and the engagement rate that they saw on each post, shown in Plot 1.
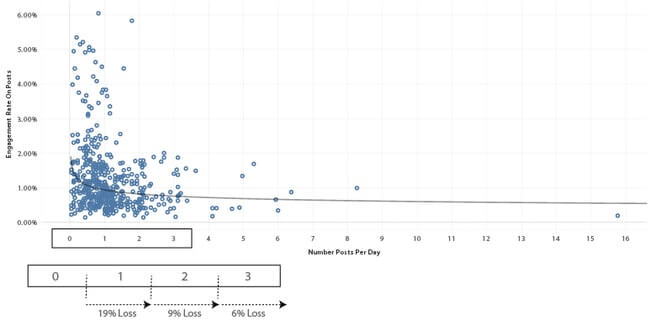
Right off the bat, we notice that the model is not linear and it certainly does not show engagement levels declining rapidly if you post more than once per day. Phew!
Instead, the model is a power curve. Looking at the plot, we can see that beyond posting once per day, the rate of engagement decline is in fact very slow. You can see this by the almost horizontal trend line from a rate of around 1.5 posts per day. In other words: brands do not suffer great engagement losses from posting frequently in this way.
Beyond posting once per day, the rate of engagement decline is in fact very slow
On average, moving from 0.5 to 1.5 posts per day equates to a 19% reduction in engagement per post. However, when we move from 1.5 up to 2.5 posts per day, we see a further loss of just 9% engagement per post. And, finally, up to 3.5 posts per day gives us a further 6% loss in engagement. Plus, you end up gaining that loss back when it comes to the engagement you get overall.
All-in-all, the value of this data is in the fact that posting frequently does not punish your engagement rate per post as much as we might think. As long as you’re sharing content that your followers want to see, your brand benefits from sharing frequently.
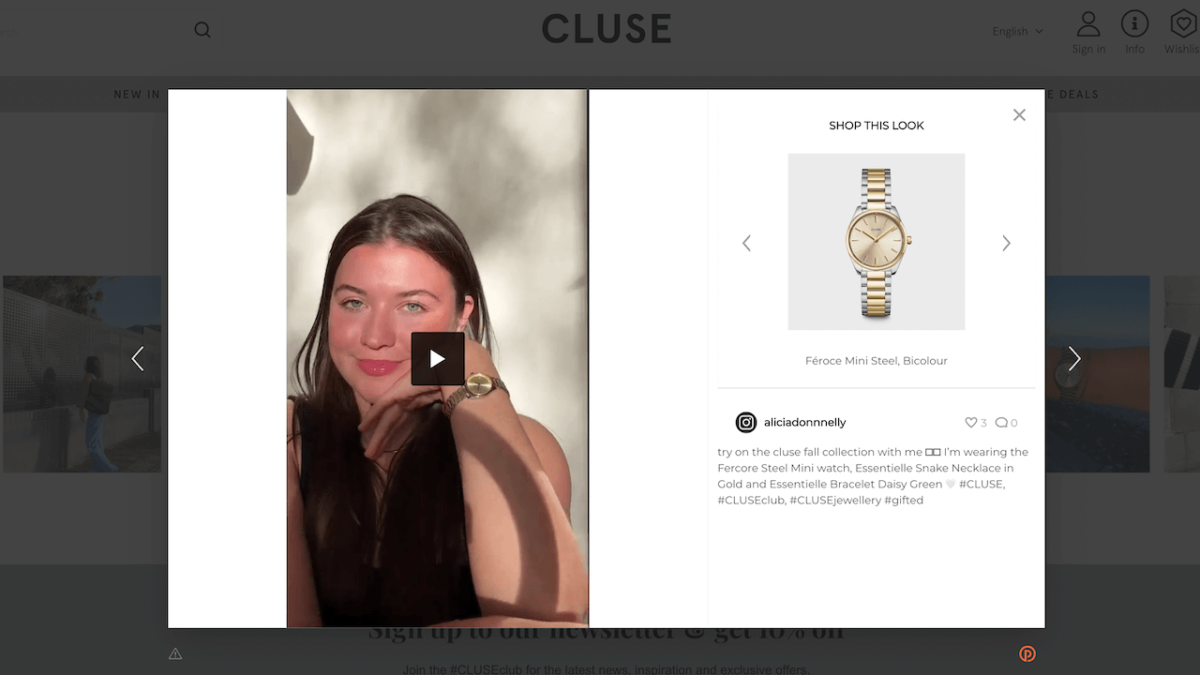
So basically, if you have the capacity to produce images or have access to an abundance of content, do it as often as you like. And, if your brand is struggling to constantly produce high-quality content, consider User Generated Content.
Look at how one of our Top 3 brands for this metric, Happy Socks, uses this Instagram marketing strategy. They have a high daily engagement rate (5.30%), and they kill it with earned content.

They have a posting rate of 6,143 times per day and are engaging more than 5% of their audience every 24 hours. With UGC, they have engaged customers and a social media manager who, I’m assuming, doesn’t have to pull their hair out over creating new content.
So what can you do with this Instagram marketing strategy insight? Don’t waste too much time fretting over your posting rate – it won’t reduce your reach! Rather use your time wisely by focusing on posting quality content that resonates with your followers.
For more analysis on Posting Rate, you can check out a similar, more in-depth analysis in our guide to posting rate here.
Let’s keep it moving, now looking at the most typical kind of engagement: likes.
Is Instagram all about the likes? In this metric, we look at engagement rate based on the number of likes per post to see what we can learn about Instagram marketing strategy.
First thing to note, we predict how well a brand should perform in terms of engagement based on the size of their followership. What exactly does that mean?
Think of it as a benchmark model. Using plot 2 as an example, the line of best fit represents our predicted value of where a brand should perform relative to the size of their followership – all the brands below this line are underperforming, and those above are overperforming. Here is where we find valuable information, especially from those brands who are a long way above this benchmark line – in other words the ones who perform way beyond our mathematically constructed expectations.
The important question: what are they doing to get there?
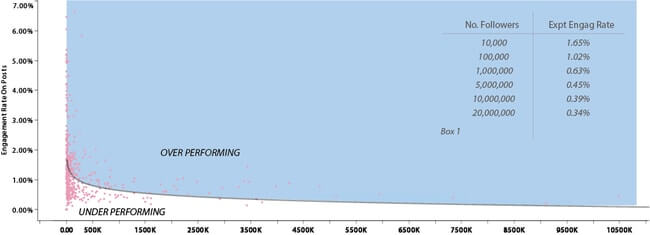
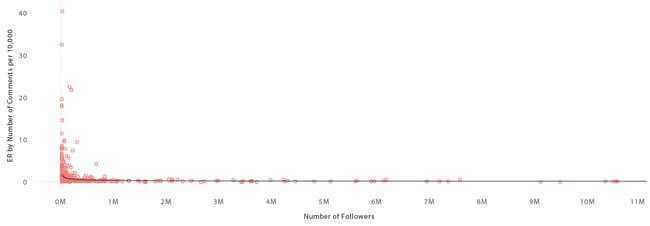
Our graph, this time, looks at the relationship between the number of likes a brand receives per post and the size of their followership. Looks familiar, doesn’t it? That’s right – because it’s another power curve.
Basically what we find is that, once a brand surpasses 100,000 followers, it becomes extremely difficult to engage more than 1% of your total audience with each post. So, as your brand becomes bigger your engagement rate is more likely to get smaller.
Once a brand surpasses 100,000 followers, it becomes extremely difficult to engage more than 1% of your total audience with each post
Maybe this isn’t what you were expecting to hear. One percent? All of this work to grow your following, and you’re only expected to engage one percent of your followership per post?
Don’t worry, there’s a light at the end of the tunnel that I’ll get into in a bit.
If you look within Plot 1 at Box 1, you can see some examples of followership sizes and their associated engagement rates. Here we see clearly that very large brands, with more than 5 million followers, simply cannot expect to receive engagement rates higher than 0.5%.
This may seem startling because of preconceived ideas of how engagement works. But really, we may be altogether misunderstanding Instagram engagement rate.
And, as I mentioned before, it’s not all bad news. Looking at our top and bottom 3 for this analysis, we can see that some brands are really doing their Instagram marketing strategy homework.
| No. Followers | EG Rate on Likes per Post | Projected Engagement | Differential | |||
| Bottom 3 | ||||||
| @puntoblancooficial | 113908 | 0.13% | 0.91% | Down 700% | ||
| @lanvinofficial | 3420076 | 0.15% | 0.45% | Down 300% | ||
| @maisonvalentino | 9472889 | 0.17% | 0.37% | Down 217% | ||
| Top 3 | ||||||
| @arizonavintage | 292908 | 5.84% | 0.75% | Up 778% | ||
| @viajaway | 154156 | 6.66% | 0.86% | Up 774% | ||
| @hawkersco | 154156 | 7.31% | 0.64% | Up 1,142% | ||
| Average | ||||||
| 730340 | 1.17% | |||||
CM Table 2- Bottom 3 / Top 3 on engagement rate as measured by likes on brand posts. We include the brand followership for comparative analysis,as well as a ‘differential’ value. This differential value shows us the extent to which each of our winners and losers are under performing and over performing respectively.
Hawkersco has over 600,00 followers (at the time of this study) and have a huge engagement rate of 7.31%. That means they get likes from over 40,000 users per post. What is it that they’re doing to get this kind of engagement?
If we look to their Instagram profile, we can find a few clues.
First of all, they are in the process of launching a new line with wildly popular actress/model Paula Echevarria (she has 2.2 million followers) and are constantly posting photos of her in their product (as is she!)

HawkersCo has also been known to use Instagram influencers and other celebrity endorsements throughout their Instagram marketing strategy.
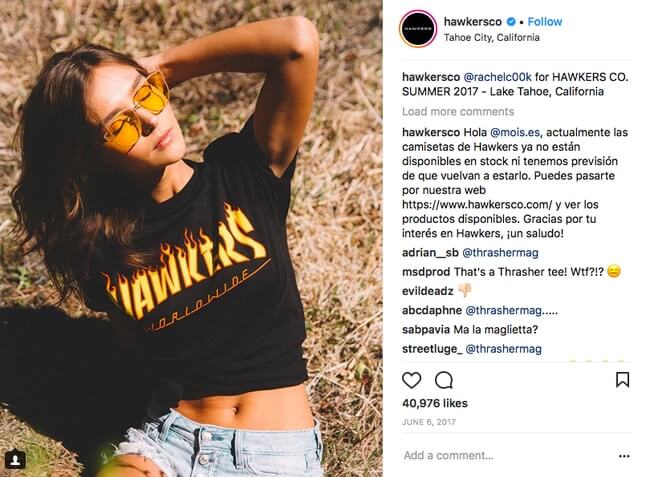
So even though a brand with over 100,000 can’t expect to push above 1.0% engagement rate, brands like HawkersCo prove that investment on the platform can pay back in full with engagement.
So what can you do with this Instagram marketing strategy insight? What this data shows us is that, at a certain point, it’s really difficult for brands with large followerships to maintain a high engagement rate – though not altogether impossible. The real question is: whether or not big brands should still be focusing their efforts on Instagram acquisition after a certain point of growth … more on this to come.
Let’s take a look at the second form of engagement: comments!
| ER by Comments per 10,000 | No. followers | Rank by Likes | |||
| Bottom 3 | |||||
| @abercrombie | 0.052 | 3434860 | 350 | ||
| @maisonvalentino | 0.068 | 9472889 | 393 | ||
| @verawanggang | 0.071 | 1605843 | 391 | ||
| Top 3 | |||||
| @aurevoircinderella_shoes | 22.562 | 160292 | 85 | ||
| @halioswatches | 32.478 | 12888 | 10 | ||
| @breakwalkshoes | 40.463 | 24429 | 11 | ||
| Average | |||||
| 1.792 | |||||
CM Table 3 – Bottom 3 / Top 3 on the rate of comments received on brand posts per 10,000 followers. Also included for comparative analysis we show the number of followers for each brand,and their associated rank value for their engagement rate by likes on brand posts.
While comments are not a component of engagement to dwell on (really only accounting for a small amount of overall Instagram engagement), they can provide some relevant insight into how well a brand’s Instagram marketing strategy is performing.
When a user goes through the effort of making a comment, it shows a concerted commitment to the brand. This, of course, does not excuse negative commitments! In any case, it’s a more authentic form of interaction.
Because the number of comments is far fewer than likes, we evaluate this metric by viewing the engagement rate by comments per post per 10,000 followers to get a better sense of the impact.
Our core metric analysis places Abercrombie, a brand with over 3 million followers, in last place out of our 395, with 0.05 comments per post for every 10,000 followers. This is a very small fraction.
Meanwhile smaller brands, like Break Walk Shoes, with less than 25k followers are able to achieve an engagement rate from comments that is 778x higher, at 40.46 per 10,000 followers.
Let’s look at the relationship between Comment Rates and Followership size in Plot 3.
If you noticed that this is once again a power curve, then you are getting the hang of this engagement thing!
So we see the exact same pattern as we saw for likes – the bigger a brand gets, the more they struggle to get engagement in the form of comments. No surprises here.
And this is clearly backed up in our Top & Bottom 3, where brands ranking well on their rate of comments received are also ranking highly for likes, too. To that we give a big: DUH.
Now you’re probably thinking, why does it matter? The numbers are so small, must we really waste our lives worrying about fractions of engagement?
This is possibly a fair conclusion. But before we toss it on the back-burner, let’s take a moment to compare ‘Likes’ and ‘Comments’ a little more carefully.
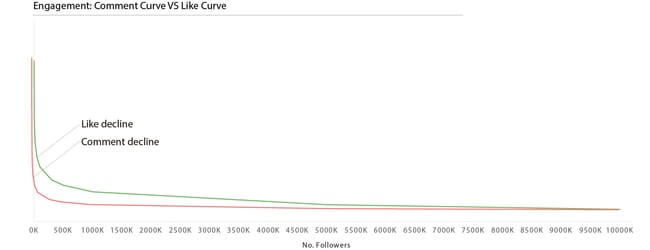
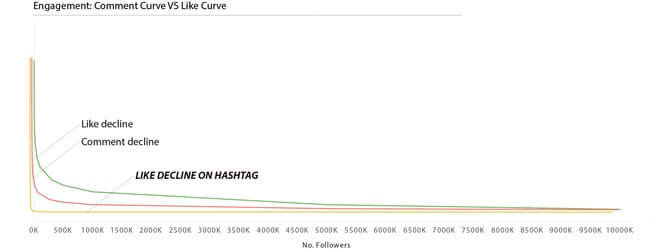
In Plot 4, you can see Likes (green) and Comments (pink) scaled to fit onto the same plot area. By comparing these relationships side by side, it becomes clear that the rate of comments received by a brand drops off much more rapidly than that of likes as a brand’s followership increases.
So basically, for a small brand, comments can be an incredibly useful tool to engage your followership: the more you’re willing to comment, the more comments you’re likely to receive. Not only that, but they then become a crucial way for smaller brands to grow and build a booming followership.
And what this data suggests is that once you get to that ‘booming place’ where your brand has really taken off, comments as a medium for engagement become somewhat irrelevant.
After reaching a certain size on Instagram, comments as a medium for engagement become somewhat irrelevant
For this metric Vera Wang ranks in our Bottom 3 with over 1 million followers and an engagement rate by comments of 0.071. But with such a large organic followership based on a recognition that proceeds Instagram, does the brand really need to worry about getting a small fraction of followers to comment on posts?
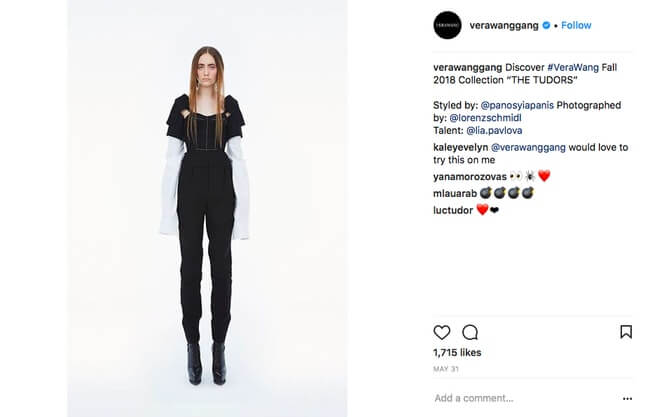
A brand of this size and stature is most likely using the platform in a different way -it’s less about engagement and more about appearing contemporary and making themselves available on social media rather than relying on it. This, based on our findings, is not a bad way for a big brand to play the Instagram marketing strategy game.
So what can you do with this Instagram marketing strategy insight? Really, Instagram engagement rates are crucial when a brand is looking to use the platform as a way for people to grow brand recognition. In this way, using every trick in the Instagram marketing book is essential. When users engage with you, engage back. This will only grow the amount of likes and comments your brand receives, as followers get to know you like any other user of the platform.
For more analysis on Established Brands VS Emerging Brands, and how their strategies differ on Instagram, you can read our in-depth piece here on Instagram strategy.
Now, we’re taking a step back from metrics related directly to brand posts and taking a leap into posts made by other users: the world of the hashtag.
Everybody talks about them, but do we really know how to use them? Time to find out what the data has to say about hashtags.
Unlike our last section, this section focuses on the part of Instagram marketing strategy over which a brand has little control. But there’s still tons we can learn about how brands are performing within these metrics, and numerous ways that brands can at least influence the ‘success’ of their hashtag.
First things first! Does your brand have a hashtag? If you don’t, it’s time to get one and start promoting its use on social media as much as possible. If you’re still struggling with this check out our guide on how to create a hashtag for your brand.
For those of you who are deciding between using your brand name as a hashtag (see: #Rayban) or creating a brand new hashtag (see: REI’s #OptOutside), we did a little extra data analysis and are happy to report that it shouldn’t affect your engagement either way.
Just remember: the most important thing is that you use a unique hashtag. When it comes to collecting your customer content, this will be crucial.
There’s no reason for Apple computers to waste time sifting through photos of fruit that have been hashtagged with #Apple. So instead, they upgraded to #ShotOniPhone, which has become a wildly successful and well-known UGC campaign.
On that note, some of our data here could be skewed by posts not meant for the brand – maybe not everyone posting with #Happysocks means to tag the sock company! But we have done our due diligence to prevent this kind of data from affecting our study: a few brands were removed from the data set for having overly ‘generic’ hashtags for this very reason.
Finally, I want to stress that all of the data we have collected does NOT include any posts made by the brand itself, meaning we’re only looking at posts in which users have included a brand’s primary hashtag.
Let’s get into it.
We’re going to start simple: How many times is your brand being tagged each day?
We can safely assume that the larger a brand’s followership is on Instagram, the more their hashtag will be used. And sure enough, our data backs up this pattern! You can see this in Plot 5.
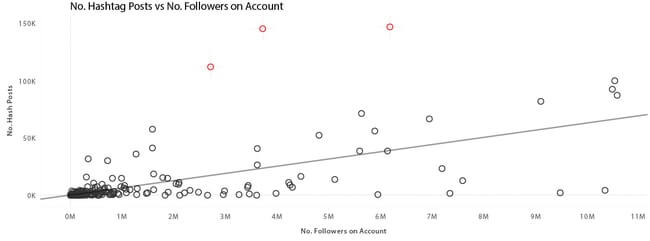
Again, see our line of best fit. From here, we can predict the brands that under or over perform in this metric. Visually we can see that a larger followership means more chance for your hashtag being used.
However, this simple analysis can’t tell the whole story on its own. Let’s take a look at our Top & Bottom brands in this metric.
| No. followers | No. Hashtag posts | Projected Score | Differential | |||
| Bottom 3 | ||||||
| @dalstontime | 6052 | 1 | 249 | Down 249x | ||
| @amichioficial | 13825 | 1 | 298 | Down 298x | ||
| @_eraseunavez | 24953 | 1 | 368 | Down 368x | ||
| Top 3 | ||||||
| @ysl | 2711391 | 111757 | 17243 | Up 6x | ||
| @rayban | 3717746 | 145259 | 23565 | Up 6x | ||
| @rolex | 6176536 | 146733 | 39010 | Up 3x | ||
| Average | ||||||
| 4810.26 | ||||||
Our Top 3 brands have large followerships, but not the largest of the bunch. Rolex, our number one scorer in this metric, has 6 million followers (at the time of this study), but other brands in our study like Calvin Klein and Versace easily pull in more users. And yet, Rolex still rakes in thousands of more hashtagged posts than, for example, Calvin Klein with 99,658 posts. And Rayban, with half the following of Rolex, is almost level pegging (50% less followers, 1% fewer hashtag posts – that’s real overperformance we see from Rayban) and only just behind in terms of this metric.
In this case, the Top 3 brands greatly over-perform on this specific metric, achieving hashtag post numbers up to 6X greater than our prediction. Why?
These brands are 3 of the most well-known brands that we have analyzed: YSL, Rayban and Rolex. This suggests that, in the case of these 3 brands, their recognition beyond Instagram hauls their number of hashtags off the charts. It is logical, but maybe not obvious, that these brands gain widespread hashtag use across Instagram and not just from their followership.
For example, people often post with #Rolex, not because they are taking a picture with the product or intend to reach the brand, but just because it’s another way of saying #luxury.

What we really take away from this specific result is that large, established brands gain traction on Instagram simply because everyone has heard about them.
You don’t need to follow Rayban on Instagram to know that they exist. But the same cannot be said about a sunglass brand that has grown up with Instagram as a major marketing medium, like another of our brands: Meller.
Their recognition beyond the platform is more restricted, and they must rely heavily on the network they have created to become known. But by encouraging hashtag use to customers with the incentive to be featured on their account, they cultivate much more authentic hashtagged posts like this one.

Though there is another way we can look at this metric; this time taking into account the size of the brand.
As with many metrics derived from Instagram, we can also convert the number of hashtagged posts into a performance score, which takes into account the size of a brand’s followership. This tells us which brands have the highest ‘differential’ value. Or, in other words – who is really punching above their weight.
This is a nice metric because it makes room for lesser known brands to show-off their active community of users that the brand is, no doubt, putting in a lot of effort to foster.
| No. followers | No. Hashtag Posts | Hash Post Performance / 1000 Followers | |||
| Bottom 3 | |||||
| @coach | 2115007 | 8 | 0.000 | ||
| @gaxswatches | 111969 | 2 | 0.001 | ||
| @unpasomasbarcelona | 132203 | 4 | 0.001 | ||
| Top 3 | |||||
| @gaimowinter | 7131 | 490 | 2.454 | ||
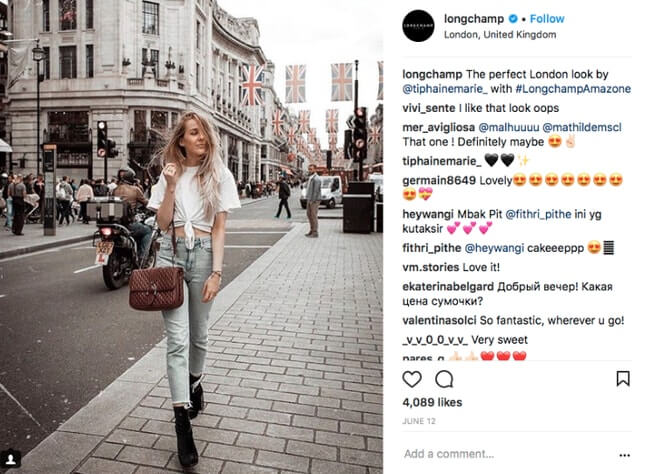
| @longchamp | 346787 | 31676 | 3.262 | ||
| @baccarat | 31598 | 3641 | 4.115 | ||
| Average | |||||
| 0.247 | |||||
Here we see a very different type of brand featured in the Top 3 list. As predicted, these brands are less recognizable and are varied in followership.
NOOSA Amsterdam, the third highest scoring brand of this metric, has a modest followership of just over 6K. This metric helps us see that they are successfully creating an active and engaged followership, even if it is smaller than competing brands. They are making the most of what they have at their disposal!

As they focus on building a community of active posters surrounding their hashtag, their brand can slowly grow into a lifestyle. Or at least, this is the idea!
An advantage worth mentioning for this metric is having an “Instagrammable” product that’s easy to take photos with on the street. This definitely gives top brands in this metric a leg-up as users are more likely to take a picture with their product.
But how do we know if a brand is really creating a community of hashtag users? We can gain some more insights in our next metric.
When we say ‘level of evangelism’ what we’re really talking about is how many ‘real fans’ your brand has – meaning people who are both proactively or unknowingly helping to promote a brand via Instagram.
In this case, we measure the level of evangelism by monitoring the number of ‘repeat users’ that post on a brand’s hashtag. For example, if I go to the beach 2 times in the month of July and post with #TargetFinds both times to show off my different swimsuits, I’ll become one of Target’s newest evangelists.
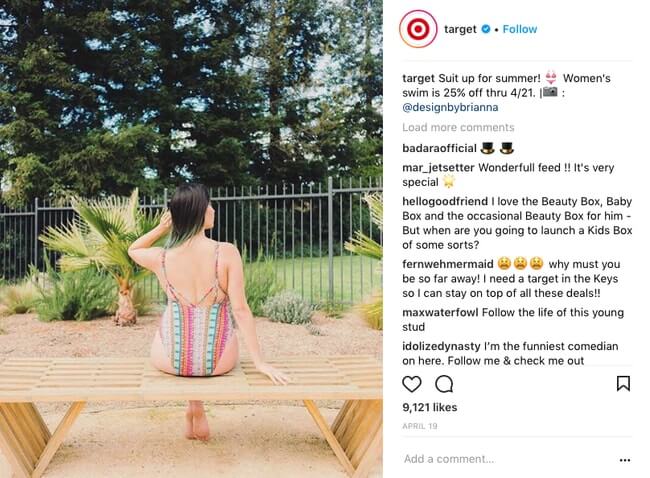
As long as an individual uses a brand’s hashtag more than once during the 28 day window of analysis, then they too are a brand evangelist and can be leveraged in your Instagram marketing strategy.
| No. Repeating Users On Hash | Repeating Users On Hash performance score | |||
| Bottom 3 | ||||
| @puntoblancooficial | 6 | 0.000 | ||
| @lanvinofficial | 1 | 0.001 | ||
| @maisonvalentino | 1 | 0.001 | ||
| Top 3 | ||||
| @noosaamsterdam | 301 | 5.231 | ||
| @baccarat | 1858 | 5.880 | ||
| @longchamp | 26297 | 7.583 | ||
| Average | ||||
| 2973.81 | 0.373 | |||
In our Top & Bottom 3, we see that the Top 3 most evangelized brands are almost the same as the Top 3 for their hashtag performance score.
This similarity is not surprising. But it does give us an indication that evangelism is a key factor that contributes towards a brand’s overall activity on their own hashtag. Or put more simply, brands with a loyal active followership – lots of evangelists – on Instagram will have a better chance of spreading their brand image throughout the network.
To test this, we ran a correlation analysis between these 2 factors: Repeat User Performance VS Hashtag Post Performance. In this instance, the relationship between these metrics is so tight, that we can assume evangelism is a major contributor towards getting the overall use of a brand’s hashtag as high as possible.
Brand evangelism is a major contributor towards getting the overall use of a brand’s hashtag as high as possible
For the data buffs out there: (DF = 394, Rsq = 0.899, P = < 0.0001)
So what we see is that evangelism is likely essential to spreading a brand’s message on Instagram via hashtags. It points towards a strategy of acquiring and motivating involved users, who will proactively help a brand push their message through Instagram.
Perhaps one proactive follower, who posts high-quality images, has the equal weight of twenty relatively idle users. There’s no way to know for sure, but this evidence certainly suggests that brands looking to market themselves on Instagram should focus their attention on this category of highly involved users.
However, there is a small catch. When the same user posts multiple times on a brand’s hashtag, in theory, they reach a similar audience each time that they post. But this isn’t necessarily a bad thing. The rule of 7, the marketing idea that people need to see an ad 7 times before it has an impact, says that it’s an advantage to keep reaching the same audiences.
So what can you do with this Instagram marketing strategy insight? Encourage your customers to post with your hashtag as much as possible. Especially if you know that they are repeat customers. Do you have a loyalty card or program? Make sure you’re always sending your devoted clients updated content on sharing their purchases on social!
In order to measure how brands can maximise their exposure to unique users, then we need to look at a metric that we call ‘unique hashtag reach’.
This one gets a little tricky, so stay with me. Our measure of unique hashtag reach tells us of the potential of a brand’s hashtag to reach unique users.
We get this by summing up the total number of followers of all the users who have posted on the brand’s primary hashtag during the window of our analysis. So, if 10 unique users each with 100 followers posted one image with #yourbrand, then the Unique Hashtag Reach would be 1,000 (or 10 x 100).
I should emphasize that we are not double counting users who have posted more than once (our trusty evangelists).
This metric is all about ‘reaching’ a new or alternative audience via the hashtag of the brand.
| Hash Reach Unique. Raw Data | Unique Reach Per Follower*** | No. Followers | |||
| Bottom 3 | |||||
| @coach | 3503 | 0.002 | 2115007 | ||
| @_eraseunavez | 228 | 0.009 | 24953 | ||
| @neltonbrand | 1087 | 0.014 | 76855 | ||
| Top 3 | |||||
| @baccarat | 5561491 | 176.01 | 31598 | ||
| @policelifestyle | 4127928 | 188.82 | 21862 | ||
| @irisvanherpen | 61358540 | 237.85 | 257969 | ||
| Average | |||||
| 12366834 | 18.30 | ||||
***Unique Reach Per Follower – is a measure of the brands relative performance on the Hashtag reach metric,by accounting for the brands size. Here we specifically measure the number of unique users reached on the brands hashtag relative to the number of followers on the brand. This provides a number that shows how well a brands hashtag is serving to leverage the brand.
Let’s hone in on the second highest and the lowest scoring, Police Lifestyle and Coach, looking at how these brands try to reach new users.
Coach has a large followership in comparison to Police Lifestyle, and yet PL reaches a far greater number of unique users. It’s difficult to say exactly why, as Coach does have the most followed Instagram user as a brand partner.

But Police Lifestyle has a steady influencer marketing campaign in place. A study by Google showed that influencers, at least on YouTube, are more influential than traditional celebrities. Could this level of influence extend to Instagram?
And in the case of the influencer below, he’s popular on both social media platforms.
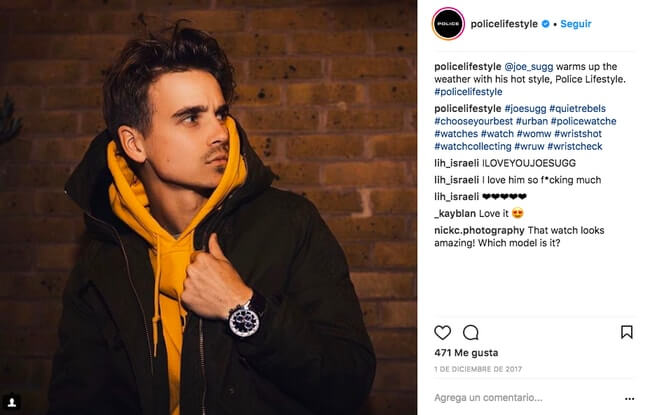
Using influencers doesn’t guarantee success, but it definitely helps spread your brand across the platform to the kinds of users you’re hoping to reach.
The staggering differences in numbers here could make this metric a Key Performance Indicator. On the other hand, it could point towards the unreliable nature of gathering hashtag data – as it is complicated by brands using generic hashtags.
In any case, the Top 20 for this metric is made up of only big brands, which could support our theory that it is previous recognition that generates really high levels of hashtag use across the platform. Because this metric isn’t intrinsically tied to a brand’s profile, it is determined more by a brand’s overall recognition.
So what can you do with this Instagram marketing strategy insight? Consider spreading your reach with a Influencer marketing strategy. And you don’t necessarily need to only work with users worth millions of followers. Sometimes the best way to reach unique users who will actually be interested in your brand is through micro-influencers. Use this resource on how to find influencers for your brand.
Let’s see what effect recognition has on this next metric: engagement rate by likes on users’ hashtagged posts.
Remember in section one when we looked at Engagement Rate on our brands’ posts? This is basically the same metric except that we’re now looking at the engagement associated with all images that include the brand’s hashtag. It’s a slightly more pragmatic measure of how well liked a brand is on Instagram, as we’re no longer looking at images posted by the brand (we exclude these completely from this metric) but at those posted by users.
Now, we get to see how much organic interaction is going on around a given brand.
| No. Followers | No. Likes on Hash | Eng Rate On Hash | |||
| Bottom 3 | |||||
| @longchamp | 346787 | 653372 | 0.00001% | ||
| @rolex | 6176536 | 26135347 | 0.00001% | ||
| @michaelkors | 10484726 | 5954414 | 0.00001% | ||
| Top 3 | |||||
| @poeteofficial | 40352 | 523 | 5.34984% | ||
| @neltonbrand | 76855 | 183 | 5.61178% | ||
| @twcowatches | 5808 | 142 | 9.59459% | ||
| Average | |||||
| 686143 | 0.379% | ||||
What is immediately clear when looking at this metric is that it drops off as a brand gets bigger. The best case in point here is that Rolex, essentially a household name, scores the highest out of all 394 brands for the ‘number of hashtag posts’ (metric 4). But, in this metric, they come second to last.
What does this tell us about their Instagram performance? This suggests that they are spread thin and wide across the network. The engagement rate on their hashtag is relatively low because the use of their hashtag is so widespread.
Engagement rate on a brand’s hashtag can be low when use of the hashtag is widespread
This pattern is comparable to what we see with engagement rates on a brand’s own posts, but it’s interesting to observe the same phenomenon beyond their account out in the ether of Instagram hashtags. The recurring theme here is that it’s difficult for big brands to maintain high engagement levels on Instagram.
Let’s take a closer look at the relationship between engagement brand followership.
| No. Followers | Expected Eng On Hash |
| 500 | 3.15% |
| 1000 | 1.48% |
| 5000 | 0.26% |
| 10000 | 0.12% |
| 20000 | 0.06% |
| 50000 | 0.02% |
| 100000 | 0.01% |
A simple comparison with engagement on brand posts shows us that that engagement on hashtag posts drops off with an increasing brand size a lot faster than that which we observed on a brand’s own posts (see it on Plot 7 – the yellow line).
And when we crunch the numbers through our mathematical model, we see that a brand cannot expect an average engagement rate higher than 0.26% on images that use their own hashtag.
This curve on Plot 7 suggests that overall engagement slumps as a brand’s followership grows. This is more significant for posts that are out of a brand’s control – meaning those found through the hashtag. Now, whether this pattern is part of the Instagram algorithm or is a reflection of user activity with larger brands is difficult to deduce. But in reality, it’s likely a combination of the two.
In a larger context, what does this mean for brands?
Large, well-established brands will find it impossible to control who is posting on their hashtag, which explains why they can’t anticipate a specific level of user quality (like we determined in Metric 3). Perhaps they are a victim of their own success, and, once established, they don’t need to worry about engagement so much, as their recognition is too big to be informed by Instagram alone.
Well-established brands will find it impossible to control who is posting on their hashtag
On the other side, emerging brands are able to exercise relatively higher levels of control over their Instagram brand community by encouraging (and possibly even paying) specific users to post on their hashtag, giving them higher levels of engagement in this specific area. As an emerging brand, you need to rely on your brand community to gain the exposure and traction to grow into a recognized brand off of the platform.
But, as we move further into a world of mobile and social, all brands will have to think about reaching and engaging users on these mediums to get a piece of the pie. For this reason, these metrics are still very important for brands that are looking to grow through the network, as well as those who are already established but are looking to extend their reach.
Let’s take a look at the Instagram marketing strategy of one of our Top 3 brands for this metric, Nelton watches.
Looking at their Instagram, it’s very clear that they are in the game of actively encouraging hashtag use from customers to be featured on their Instagram account.
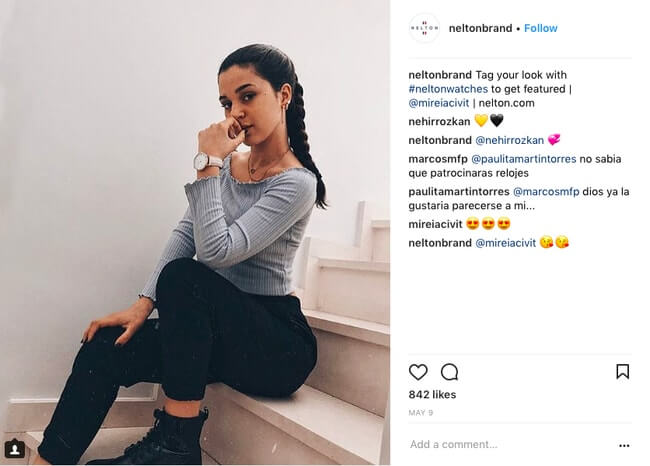
Most of their recent photos on their account have been attributed to a specific user. Many of whom have huge followerships, meaning that these mentions may have cost the brand in either monetary compensation or free products. And it’s paying off! They have huge engagement rates on hashtagged posts, meaning that their brand image spreads a lot further than the brand could get with their own posts.
The real question then becomes: at what point has a brand reached enough of the ‘right’ users to create a large enough brand community off the platform to not depend on engagement within the platform to sell products?
Customer acquisition can cost you, so emerging brands need to learn new ways to generate buzz and engagement without cost (hello, User Generated Content strategy).
For now, it’s safe to say that it’s always good to get people talking about your brand (with hashtags!) where they hangout. And these days, that’s Instagram.
So what can you do with this Instagram marketing strategy insight? Read more about Established Brands VS Emerging Brands and their differing strategies in our Instagram strategy post.
That’s it for metrics on hashtags – now for our final Instagram marketing strategy section. Something that’s been brought up but not fully explored: User Quality.
Our last section of this Instagram marketing strategy guide looks at the kinds of users posting on a brand’s primary hashtag, a group that the brand has fairly limited control over. For this, we look at what we like to call ‘influential users’ posting on a brand’s primary hashtag.
Our definition of ‘influential users’ for this study was set at a threshold of 8,000 followers and an average engagement rate higher than 2%.
Let’s dive right in.
Here we’re looking at the number of influential users that post on a brand’s hashtag. This could mean organic posts by influential users or paid/incentivized posts by influencers – anything goes!
To give it some color, we’ve also included the measure of ‘proportion of influential users’ – this shows us how many out of the users posting on a brand’s hashtag are of ‘influential’ status.
Let’s look at our Top & Bottom 3.
| No. Influential Users On Hash | Proportion Inf Users On Hash | No. Acc Followers | |||
| Bottom 3 | |||||
| @charmedaroma | 1 | 0.162% | 114991 | ||
| @fragrant_jewels | 1 | 0.251% | 213773 | ||
| @riverstones_jewels | 1 | 0.556% | 6626 | ||
| Top 3 | |||||
| @Calvinklein | 1741 | 4.212% | 10,527,385 | ||
| @rayban | 2076 | 2.488% | 3,717,746 | ||
| @danielwellington | 3927 | 18.633% | 3,612,665 | ||
| Average | |||||
| 75.03 | 5.92% | ||||
Core metric analysis – Here our core metric analysis top 3 / bottom 3 are ranked based on the number of Influential users. Note: in this instance we exclude brands that have 0 influential users.
First thing to note: Daniel Wellington (our number one ranking brand for this metric) has an extraordinary number of influential users posting on their hashtag. At 3,927 influential users they score more than double that of Calvin Klein – who rank third in this metric.
Not only that but Daniel Wellington’s ‘proportion of influential users’ is more than 7x greater than that of Ray Ban (second place) and more than 4x greater than that of Calvin Klein. They are putting in some serious work on Instagram! This shows us that Daniel Wellington has managed to exert unparalleled influence over the users posting on their hashtag.
Next, we’re going to look at the top 25 performing brands in terms of these two metrics.
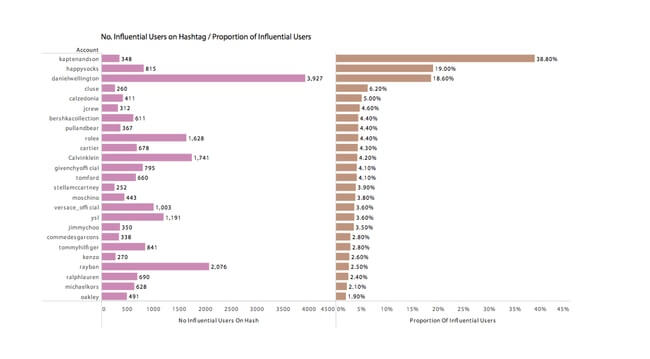
Plot 8 shows, perhaps unsurprisingly, that almost all of the brands who score highly for their absolute number of influential users are all well-established brands including Calvin Klein, J. Crew, Tom Ford, and Kenzo to name a few.
But here’s where it gets interesting. Of these top 25 brands, 21 of them score below average (5.29%) for their ‘proportion of influential users’. Meanwhile, the 3 top performing scorers are doing more than their fair share to drive up that average.
Here we see that the Top 3 in this metric, Kapten and Son, Daniel Wellington, and Happy Socks, are massive outliers. What this demonstrates is that other brands, beyond the Instagram masters at Daniel Wellington, are managing to exert real influence over the users posting on their hashtag.
But no one can quite match DW – it’s the only brand that ranks highly in both influential users and the proportion of influential users at the same time. This shows the scale at which Daniel Wellington’s influencer marketing strategy is performing; a level to which none of the other 393 brands even compare.
One glimpse at their Instagram account, and there’s really no doubt as to why.

They’ve mastered the art of collecting User Generated Content, and they have a booming base of loyal users to prove it. DW is the perfect example of a brand that has leveraged the ‘best’ influencers, micro-influencers, and influential users for their brand image, thus mobilizing ‘normal’ Instagram users to become content creators for the brand. They can then use them all to continue spreading their brand across the platform.
Users post for the brand because they too want the chance to be featured on one of the coolest accounts on Instagram. Buying watches and taking photos tailored to the Daniel Wellington style, these users identify with the brand image while also helping to shape it.
So what can you do with this Instagram marketing strategy insight? Get users posting on your hashtag – especially the kinds of users that we’ll actually help your brand sell socially. Encourage customers on emails, newsletters, in-store and all over social. Then, have their favorite influencers encouraging them to do the same!
For more insight on this, read our more in-depth data analysis on influential users & influencers.
We’re going to take it one step further to understand how account size affects the proportion of influential users. By correlating ‘account followership size’ with the ‘proportion of influential users’, we can see in Plot 9 how the number of influential users varies as a brand increases its followership.
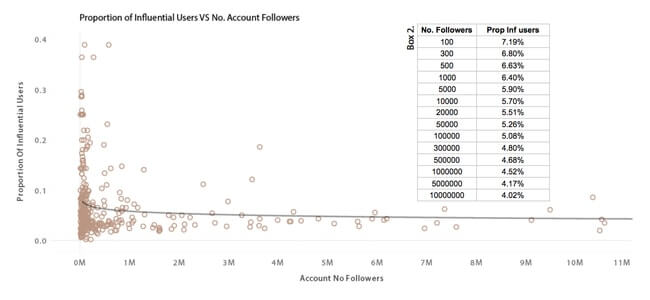
Here we see that, in fact, larger brands tend to have a lower proportion of influential users, as compared to smaller brands.
But this relationship is not the usual ‘power curve’. Instead, it is better described as a logarithmic curve.
If you’re scratching your head, you can take a look at Box 2, as shown in Plot 9. Box 2 shows that the difference between 100 followers and 10 million followers is only a redaction of just over 3% on the proportion of influential users.
The difference between 100 follower and 10 million followers is only a redaction of just over 3% on the proportion of influential users
This is a very subtle difference – but why do we see this pattern at all?
Thinking back to our conclusion in our second section, Metrics on Hashtag, we can see the same effects here. Big brands struggle to gain engagement on their hashtag because it tends to be used by a widespread group of normal users. With a greater level of hashtag use, comes less control over the users of the hashtag.
Rayban is so well-known that their hashtag is often used just to garner attention to a sub-related topic.

While being widespread enough to have your brand name used outside of your product isn’t necessarily a bad thing, brands can quickly lose control of brand image on Instagram.
Plus, this level of recognition hasn’t yet been achieved by an emerging brand through Instagram. But will it?
Will Daniel Wellington achieve household name status through Instagram? Could HawkersCo be the Rayban of the future because of social media?
We can’t say for sure, but we do know that they are some of the best examples out there of a winning Instagram marketing strategy.
Now let’s look at the big picture. What do these metrics tell us about Instagram marketing strategy? There are a few conclusions to draw, the most important of which is that the real stars on Instagram are doing everything.
It’s immediately clear once on the platform which brands receive their high scores because they are putting in the work and those that ride on previous recognition (some use both brilliantly, like Calvin Klein). But the brands that are leveraging the network to go from unknown to the latest trend are using every Instagram resource available to them to get there. That means Influencers, influential users, User Generated Content marketing. They also go on the network to engage with customers – commenting, liking, and answering questions – almost like real Instagram users instead of a brand.
So what can we learn from these metrics? A winning Instagram marketing strategy is a diverse one. Brands shouldn’t be afraid to try out a mixed bag of Instagram marketing strategy in order to find the sweet spot for their products. But remember: the most successful brands on Instagram are extremely pro-active in their approach, meticulously controlling images posted by the brand itself and on their hashtag. Because, in the end, presenting a specific and well-developed brand image gives users an idea to aspire to and identify with that cannot be beat.
We hope you’ve gained some insight into Instagram marketing strategy and what you can do to get your brand ready to compete on this crucial social selling network. If you have any questions on any of these metrics, please let us know in the comments below!
Looking for more Instagram tips? Head to our complete guide to Instagram Marketing, where you’ll find everything you need to know about promoting your products on this crucial platform.